As someone who has worked in the field of performance tracking for agencies, I’ve found that choosing the right tools and leveraging them correctly can make all the difference when it comes to agency success. Whether you run a marketing agency, a consultancy, or any other type of service-based organization, measuring performance is critical. In this article, I will share how analytics and reporting software can empower you to track agency performance effectively. I’ll walk you through what’s involved in choosing the best tools, the importance of tracking key metrics, and practical tips for getting the most out of your data. By the end, I hope you will have a clear understanding of how to use these systems to enhance performance and drive growth for your agency.
The Importance of Tracking Agency Performance
First, let’s start by defining why performance tracking is essential. Agencies thrive on delivering results to clients. The more you can measure and optimize your agency’s performance, the better you can showcase your value to clients, build long-term relationships, and scale your business.
Tracking agency performance means looking at key metrics such as project completion rates, client satisfaction, revenue generation, and operational efficiency. Without tracking these indicators, you’re left in the dark. While intuition and experience are valuable, relying solely on them won’t give you the clear, data-backed insights you need to make informed decisions.
The Role of Analytics and Reporting Software
Analytics and reporting software act as the backbone for agency performance tracking. They provide a structured, automated approach to gather, analyze, and present data. These tools can track a wide range of data points, from website traffic to client interaction statistics, and present them in clear, digestible reports. When used correctly, they save time, improve decision-making, and help agencies stay ahead of the competition.
I’ve worked with several tools over the years, and they all come with a unique set of features and benefits. Let me share what I’ve learned and what’s worked best for me.
Key Features of Analytics and Reporting Software
Before diving into the various types of software, I’ll outline the key features I believe are essential for tracking agency performance:
- Data Collection: The tool should automatically collect data from various sources like websites, social media platforms, and CRM systems.
- Customization: It should allow customization of the metrics you track, so you can align the data with your specific goals.
- Data Visualization: The software should present data in a visual format, such as graphs and charts, to make it easy to understand at a glance.
- Real-Time Reporting: Real-time data reporting helps you make immediate adjustments when something isn’t working.
- Collaborative Features: The software should allow team members to access and share reports, fostering collaboration and communication within the agency.
Popular Analytics and Reporting Software Options for Agencies
Now, let’s take a closer look at some of the most popular analytics and reporting software options available today. These tools differ in features, price, and user interface, so it’s essential to compare them based on your agency’s specific needs.
| Software | Best For | Key Features | Pros | Cons |
|---|---|---|---|---|
| Google Analytics | Website performance tracking | Traffic monitoring, audience insights, conversion tracking | Free, widely used, highly customizable | Can be complex for beginners |
| HubSpot | Client relationship management | Marketing analytics, lead tracking, sales reporting | All-in-one CRM, easy to use | Higher cost, may not suit small agencies |
| SEMrush | SEO performance | Organic traffic analysis, keyword tracking | Strong SEO focus, competitive analysis | Can be overwhelming for non-SEO experts |
| Zoho Analytics | Data visualization | Customizable dashboards, data importing from various sources | Affordable, user-friendly | Limited integrations compared to other tools |
| Klipfolio | Real-time reporting | Real-time data monitoring, KPI dashboards | Customizable, integrates with other platforms | Can be expensive at scale |
How to Choose the Right Software for Your Agency
When choosing the right software for your agency, I believe you should consider the following factors:
- Budget: For agencies just starting, there are free or low-cost tools that still offer great insights. Larger agencies with bigger budgets may opt for more advanced systems.
- Usability: The software should be easy to navigate. The simpler, the better—especially when team members from different backgrounds are involved.
- Scalability: As your agency grows, you’ll want a solution that grows with you. Ensure the software can handle more data and users as your team expands.
- Integrations: It’s essential that the software integrates well with the tools you’re already using. The smoother the integration, the less manual work involved.
- Customer Support: Solid customer support is crucial when technical issues arise. I’ve found that responsive, helpful support can make a big difference.
Common Metrics to Track with Analytics Software
One of the most valuable aspects of using analytics and reporting software is the ability to track a wide range of metrics. Here are some common metrics I track to gauge agency performance:
- Client Acquisition Cost (CAC): This tells you how much it costs to acquire a new client. By comparing CAC to the lifetime value of a client, you can determine if your marketing efforts are efficient.
- Lead Conversion Rate: This metric tracks how many leads you convert into paying clients. It’s an essential indicator of your agency’s sales performance.
- Client Retention Rate: The percentage of clients who continue to work with your agency over time. A high retention rate is a strong indicator of success.
- Project Completion Rate: How often projects are completed on time and within budget. This can indicate how well your agency manages resources and timelines.
- Revenue Growth: Tracking revenue growth is vital to measure the overall financial health of the agency.
- Employee Productivity: By tracking employee output, you can ensure that your team is performing optimally and identify areas for improvement.
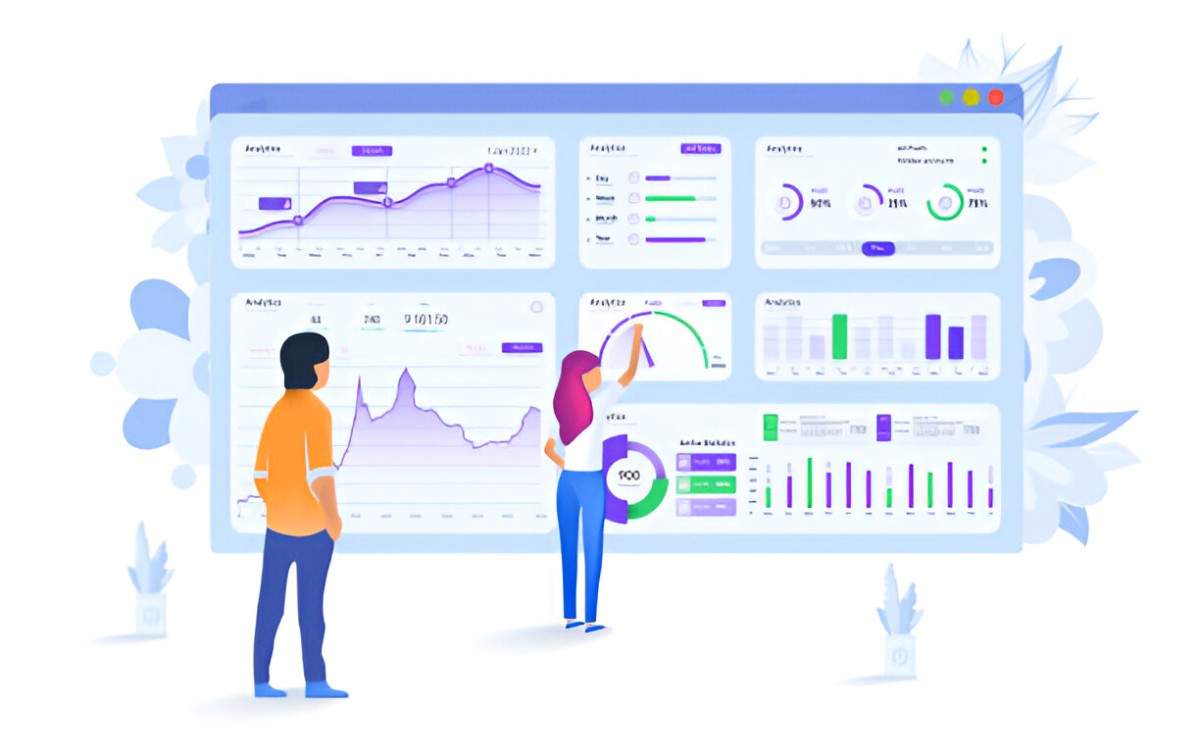
The Benefits of Data Visualization in Reporting
One feature that I particularly appreciate in many analytics tools is data visualization. Data can quickly become overwhelming if it’s presented in raw numbers. When data is visualized—through graphs, pie charts, and dashboards—it becomes much easier to comprehend.
For example, instead of just seeing a list of website visitors and their behaviors, a visualization tool can present this data in an easy-to-digest bar graph or pie chart. This makes it easier to spot trends and act on them quickly.
Using Real-Time Data for Quick Adjustments
Real-time data is another aspect I find incredibly valuable. When you have the ability to track performance metrics in real time, you can adjust campaigns or operations on the fly. If something is not working, you’ll know immediately and can make a change before it’s too late.
For example, I remember a situation where I was working with a marketing agency. They noticed a significant drop in website traffic over a weekend. By accessing their real-time data, they quickly identified a technical issue with their site, which they were able to resolve within hours, preventing any further damage to traffic.
Reporting: Turning Data Into Actionable Insights
While tracking data is essential, it’s only half the battle. The other half is interpreting and acting on that data. That’s where reporting comes in. Reporting is about distilling large amounts of data into actionable insights that inform decision-making.
I prefer to keep my reports focused on a few key performance indicators (KPIs) rather than overwhelming clients or internal stakeholders with too much information. A concise report that clearly shows progress against objectives is far more impactful.
Collaborating with Your Team Using Analytics Data
One of the benefits of using software is the ability to collaborate with your team. Instead of sending around multiple spreadsheets or emails, you can create shared dashboards and reports. This enables everyone to stay aligned, track progress, and work together towards common goals.
I’ve found this to be especially helpful when working with remote teams. Shared dashboards allow team members to see real-time data from anywhere, which helps ensure everyone is on the same page.
Advanced Analytics: Predictive and Prescriptive Insights
If you’re looking to take your agency’s performance tracking to the next level, you might want to explore predictive and prescriptive analytics. These advanced techniques analyze historical data to predict future outcomes and recommend actions to improve performance.
For example, predictive analytics can forecast trends in client behavior or project timelines, while prescriptive analytics can suggest strategies for optimizing team productivity or customer engagement. While more complex, these tools provide a deeper level of insight and can help agencies stay ahead of the curve.
Conclusion
Tracking agency performance with analytics and reporting software is a game-changer. It enables you to measure your efforts, make informed decisions, and demonstrate the value of your work to clients. I’ve seen firsthand how these tools can transform an agency’s operations, and I believe that with the right approach, they can do the same for you.
By understanding key metrics, choosing the right tools, and leveraging data effectively, you can ensure your agency is on the right path toward sustained success. It may take time to master the process, but with patience and practice, you’ll find that tracking performance becomes second nature.


